The Best 3D Graphing Calculators (Online & Offline)

Whether you have to be guided step by step or just check a solution, check out the best 3D graphing calculator software tools!
The handheld 3D graphing calculator is a staple for any high school student who has moved beyond basic math. The help it provides is immeasurable, as displaying graphs is an essential aid for understanding advanced problems. At the same time, even a calculator can reach its limit – be it the battery, the dimension of the screen, the accuracy, or the functions available.
While such handheld devices remain a terrific tool for standardized tests and exams, a software alternative that can be used on smartphones and PCs will unlock an abundance of new functions and possibilities. Professionals can also benefit from 3D graphing calculator software. Spreadsheets can be loaded into many of them to perform statistical and other operations. That’s why we compiled a list of some of the best 3D graphing calculator software tools.
But before we jump into the action, let’s find out just what exactly a graphing calculator is.

What Is a Graphing Calculator?
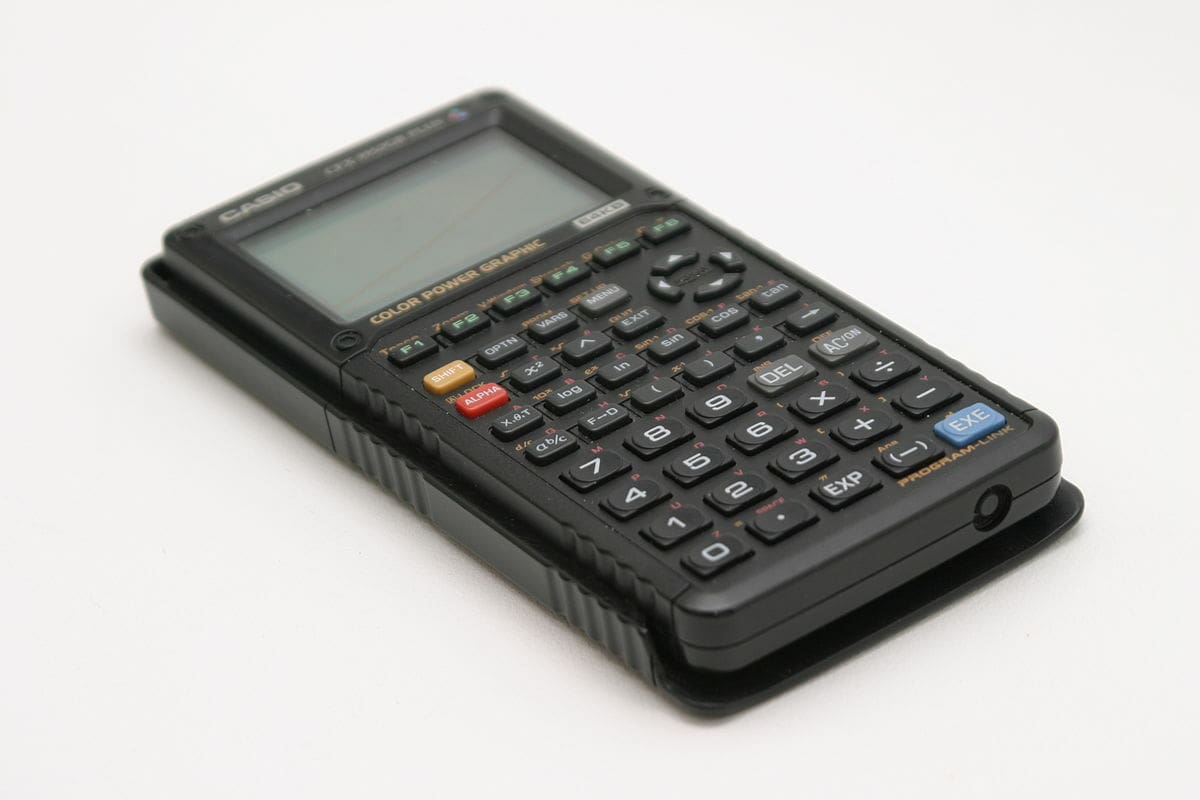
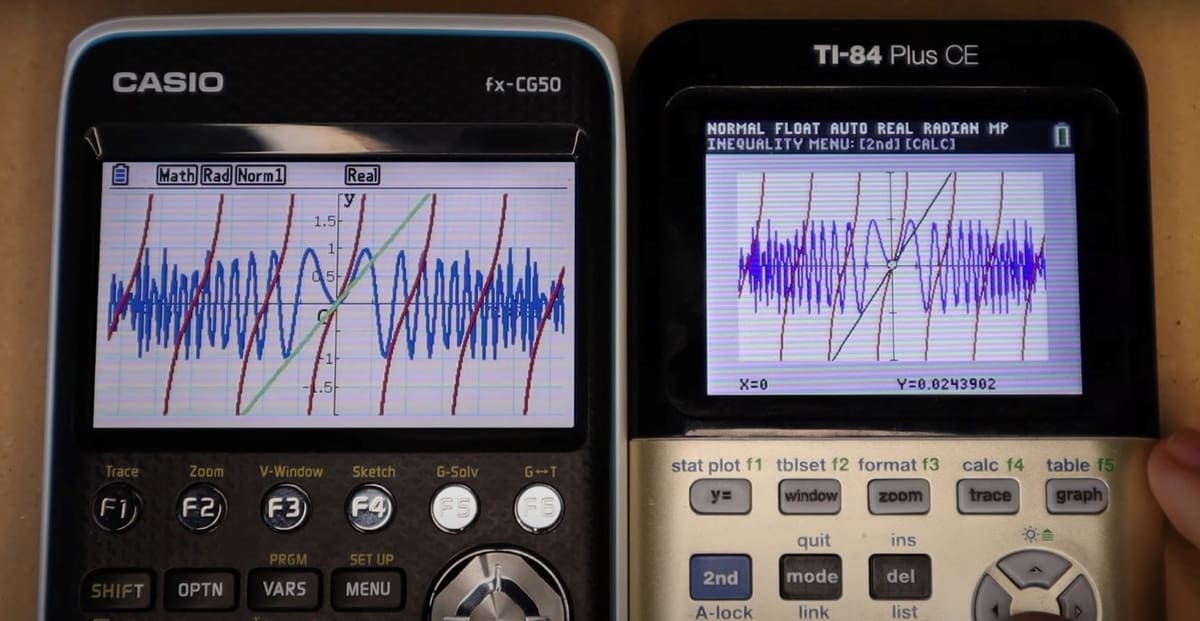
A graphing calculator is a handheld computer able to plot graphs from a user-input function. The first commercially available graphing calculator, the fx-7000G, was launched in 1985 by Casio. After seeing the immediate and immense success, Texas Instruments and Hewlett-Packard jumped on the trend too. For years, three companies held an oligopoly on the market of handheld numerical devices.
A graphing calculator (also called a graphic display calculator) isn’t the same thing as a handheld scientific calculator. The larger screen space allows it to show standard expressions, where the symbolic notation is the same as the one in textbooks. More powerful processors and a larger memory mean they can handle larger sets of data, increasing the resolution of the answers and unlocking new possibilities. Many newer models can be interfaced with a PC via USB and allow user-written programs (oftentimes in Python or C++) to be executed. Some calculators can even run games!
Advanced models support external sensors and probes, allowing for scientific data collection. The mathematical operations they can perform are more advanced too. From solving integers and derivates to plotting vector fields and graph intersections, they’re truly the Swiss Army knife of mathematicians. Or are they?
Handheld vs. Software
It should be clear by now that graphing calculators are, by all means, computers. They have a full-fledge operating system, a user interface, and sometimes a color touchscreen. They can perform difficult tasks on a powerful set of hardware. They also run on a rechargeable battery, the runtime of which is oftentimes measured in days rather than months (like for scientific calculators).
Basically, it’s a second or third computer, after your laptop and smartphone, that occupies space in your backpack. The natural question that pops up is: Why should I spend hundreds of dollars on a third, extremely specialized device if I already have two powerful and versatile computing units always with me? Can’t I plot graphs on my smartphone or PC?
Yes, You Can!
Yes, you can use software packages to carry out the same tasks on a smartphone or PC instead of a calculator. In fact, you can achieve much more than what the best graphing calculator can do.
Software graphing tools offer a more intuitive interface, something the user is familiar with. They can leverage the computational power of the device itself to go beyond the capabilities of a handheld. They usually feature more precise and versatile equation solvers. They benefit from the built-in connectivity to share and collaborate with other persons and devices. The software is oftentimes free, open-source, and can run on pretty much any device (including no-install-required, browser versions). Seems great, right?
Though, software can present its own limits. While it can perform all the tasks of a graphing calculator, faster and more precisely, very few tools actually include all of the features of a handheld. Some might plot 2D and 3D graphs but don’t offer step-by-step solutions. Others can solve all types of equations and inequations, but the software requires the user to input the equations in a specific form. Others have an outdated interface.
But most importantly, no standardized tests and exams allow the candidate to use a smartphone or computer. Testing authorities also impose limitations on a series of handhelds. For instance, those that support CAS (Computer Algebra System, which can solve equations with a human-like approach) are banned. Usually, a list of permitted calculators, dictated by the testing authorities’ board, is available for everyone to consult.
We can divide the pros and cons as follows:
Handheld
Pros
- Unified interface, all functions accessible from the same place
- Compact design, self-sufficient operability
- Can be used on standardized tests (depending on the model)
- Specific models support external sensors and probes
Cons
- Runs on batteries
- Can get pricey and become obsolete in the arc of a few years
- The screen size is bigger than usual calculators, but still pretty small
- Can solve only a specific set of functions that the manufacturer included
- Input and interface navigation might seem unintuitive at first
Software
Pros
- Both paid and free alternatives are available
- Doesn’t require additional hardware to run (browsers versions are suitable for older devices too)
- Expanded functionalities
- Easier to navigate 3D graphs, with many rendering options
- Can export the results rapidly and in a multitude of formats
- Usually kept up-to-date
Cons
- Not accepted on standardized tests
- Functions might be less intuitive to get to and scattered all over the interface
- Multiple tools are needed to fully cover every feature of a graphing calculator
What Should I Pick?
Well, it depends. The common-sense answer is: if you need to use it on a test basis, get a handheld. If you need help with homework, grading, teaching, or sporadic results checks, most of the free software entries on this list will work just fine.
The teacher’s needs aren’t the same as the student’s or the engineer’s. Everyone has different requirements. A good approach would be to try out all the free software tools we have listed. If they aren’t enough, consider picking a graphing calculator.
Considerations
What makes a 3D graphing calculator actually good? For us, it’s the following key points:
- Available functions: A good calculator should be able to perform above-average tasks natively. The four operations (addition, subtraction, multiplication, division) and common trigonometric functions (sin, cos, tan, and inverse) are a must. Everything in excess of that (derivatives, integrals, differential calculus, statistics) is considered the starting point. CAS and step-by-step equation solving are appreciated too.
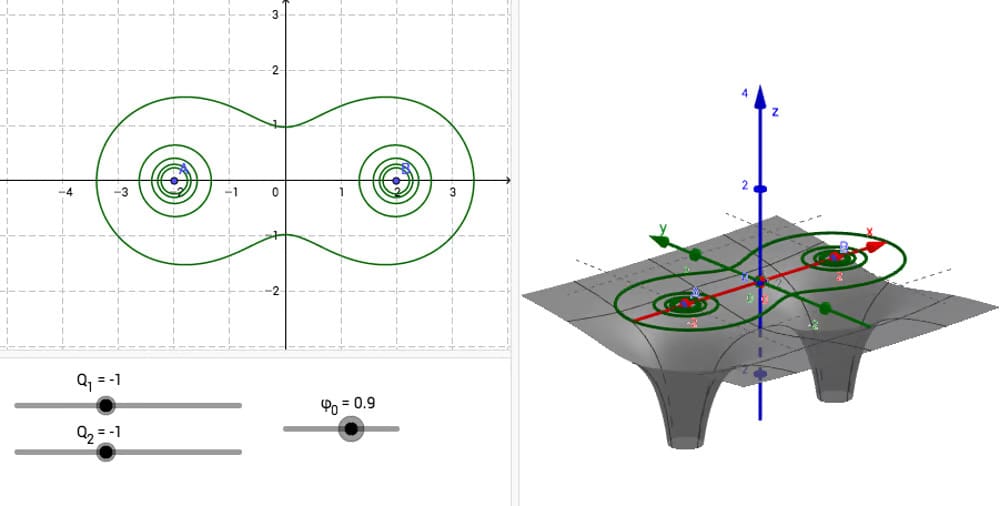
- 3D functionality: While 2D plotting might be enough for high school classes, calculus and physics problems often require working with more than two variables. The calculator’s rendering engine should be up to the task.
- Learning curve: Let’s be honest – math is no easy stuff. And having to learn an entirely new, separate interface on top of that might be out of reach for many. So, we’ve included options for different levels, from high school to professionals.
- Pedagogy: Again, math is not easy stuff for many students. For this very reason, every tool that makes understanding and mastering the subject less difficult or even fun is more than welcome on this list. When a certain program offers classroom-oriented features, we’ll mention it. If you’re a teacher, we suggest taking a look at the sections dedicated to Desmos and Geogebra.
The List
Based on those considerations, we compiled a list of 19 different software tools. We’ll cover the basics, including the programs’ graphic mode, compatible operating systems, and price. We’ve also rated each program’s ease of use on a 5-point scale, based on the difficulty and additional knowledge needed to operate the calculator. Mastery of the theory is taken for granted.
And to make it especially easy for you, we’ve divided the entries into three categories:
- Entry Level: It can be used as an everyday tool for simple calculations without requiring any additional skills. Teachers and learners from elementary to high school can use it to check answers and solve homework.
- Intermediate Level: For more advanced high school classes and college students. They require a bit of getting used to, but they also offer more advanced features and are generally more versatile.
- Advanced/Professional Level: For seasoned students, engineers, lab personnel, and professors alike. These programs require additional and specific knowledge on how to navigate the interface, input functions, and interpret the results. At the same time, they unlock a whole new realm of mathematics and data analysis.
Finally, with all of that out of the way, let’s check out our list!
Entry-Level
If you’re looking at a straightforward, I-only-want-my-answer type of calculator, look no further. Here are our top picks.
Academo

Academo features an easy-to-use 3D surface plotter. The interface is pretty basic, allowing the input of the formula and not much else. You can trace the values of the graph by tracing over it with your mouse. Fine-tune the result by setting the range for the variables. Viewing options for the rendering engine are limited (the plot can be rotated and enlarged), but they will suffice for most users.
Academo doesn’t include CAS functionalities, meaning it will not calculate the solutions of the equation displayed. The range of possible functions that can be entered into the expression box covers most of what’s included in the standard algebra curriculum. Possible expressions include sin, cos, tan, square root, logarithms, and a few other essentials. Last but not least, you can share the graph by sending the link since the expression is included in the URL.
Overall, this may not be the most sophisticated 3D graphing calculator software tool, but it will perform just fine for the operations it was designed for. Academo also offers a 3D vector and contour plotter, as well as a few other tools.
- Graphic mode: 3D
- OS: Browser
- Price: Free
- Ease of use: 5/5
Algeo

Algeo is an Android app with a user interface that resembles the stock Android calculator. It can plot functions and calculate solutions (such as the zero of a function). In case you need the values of a range of points, the 2D graphing tool can output a table of values instantly. This feature allows you to correct your own solutions in a breeze.
Instead of squeezing your expression in a single line, Algeo displays the input symbolically. Also, it answers your formulas automatically. Definite integrals and Taylor series are supported on top of the standard set of features of a scientific calculator.
When purchased, you can remove ads and use more complex numbers functions.
- Graphic mode: 2D, 3D
- OS: Android
- Price: Freemium
- Ease of use: 5/5
Desmos
Desmos is a high-grade, 2D graphing calculator tool for browsers and mobile devices that can be used for free. This browser app uses an easy-to-remember interface for entering expressions. While you can simply use it as a tool for a once in a while check, it also comes with a math learning platform.
Teachers, listen up! Desmos provides many classroom activities ready for use, but if they don’t fit your student’s needs, you can always create your own with the included activity builder.
Desmos is well-suited for demonstrating algebraic phenomena in the classroom, as it comes with a rendering mode that increases the contrast of the graphs for beamer projection. The tool also caters to the need of blind students by verbally reading the output. Not only can Desmos be configured to read expressions, but it can also render graphs as audio loops of modulated tone pitch, points of interest, such as intersections, are rendered as pop sounds and other sonic aids. Isn’t that cool?
- Graphic mode: 2D
- OS: Browser, iOS, Android
- Price: Free
- Ease of use: 5/5
GeoGebra
GeoGebra is a free 2D and 3D graphing calculator software that has been developed for use in mathematics and science education. It’s the most widespread graphing tool in classrooms all over the globe. In the program, constructions can be made using points, vectors, segments, lines, polygons, conic sections, inequalities, implicit polynomials, and functions. These elements can then be dynamically modified to better understand their properties.
Moreover, constructions can be studied across a range of different perspectives. This allows students to, for instance, study geometric objects from the vantage point of algebra. CAS functionality is also supported.
The online learning capabilities of the GeoGebra Suite are particularly strong: Teachers can create worksheets that they share with their class to solve or use pre-made templates and lessons. Live, class-wide interactive whiteboards are also available. This will allow the student to feel more like a participant and less like a spectator, ultimately breaking the cyclical thought “I cannot understand math, therefore why try in the first place?”
- Graphic mode: 2D, 3D
- OS: Browser, Windows, MacOS, Chromebook, Linux, Android, iOS
- Price: Free
- Ease of use: 5/5
Grapher
For those who own a Mac, one of the best 3D graphing tools is already bundled with MacOS X (10.4 and later). Grapher is a capable 2D and 3D graphing software that supports various coordinate systems (linear, polar coordinates, linear-logarithmic, log-log, and polar log).
At the top of the window, you can enter the expression. You don’t have to learn a new notation for entering expressions since it comes with an equation palette that allows you to drag and drop the most common symbols. As you enter expression after expression in the top field they will be overlaid in the viewport. You can quickly navigate them and select or deselect them in the history tab to the left of the viewport.
In addition to curve plots, you can also load spreadsheets to create a point plot. Grapher’s inspector helps you prepare your graph for publication. It allows you to select different styles of lines (such as straight or Bezier), the color, the marks used to designate points, and much more. In case you want to create a variable parameter animation, Grapher allows you to render it and save it as a QuickTime movie file too.
- Graphic mode: 2D, 3D
- OS: MacOS
- Price: Free
- Ease of use: 4/5
Math42
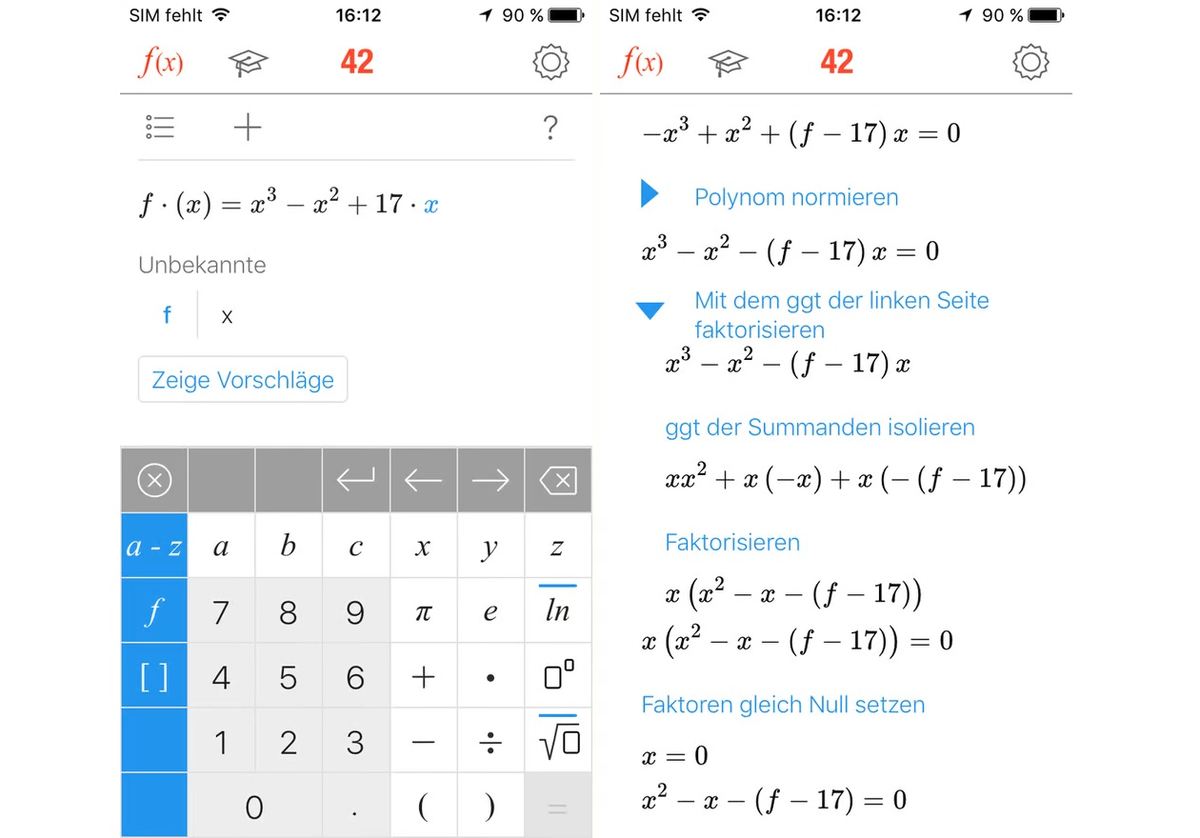
This free German-engineered app shines when solving equations while showing you the approach and tips on how to do it yourself. It’s a must-have for anyone who struggles with solving mathematical problems.
Math42 can easily work with equations consisting of multiple unknown figures, numeric data, or pure alphabetical letters. It also offers a 2D plot feature. It calculates the points of intersections, gradient, and boundary values. Math42 has a built-in tutor that helps train your mental arithmetic on the run.
- Graphic mode: 2D
- OS: Android
- Price: Free
- Ease of use: 5/5
Intermediate
When basic stuff isn’t cutting it anymore and you need to pass on to the next level.
AlmostTI
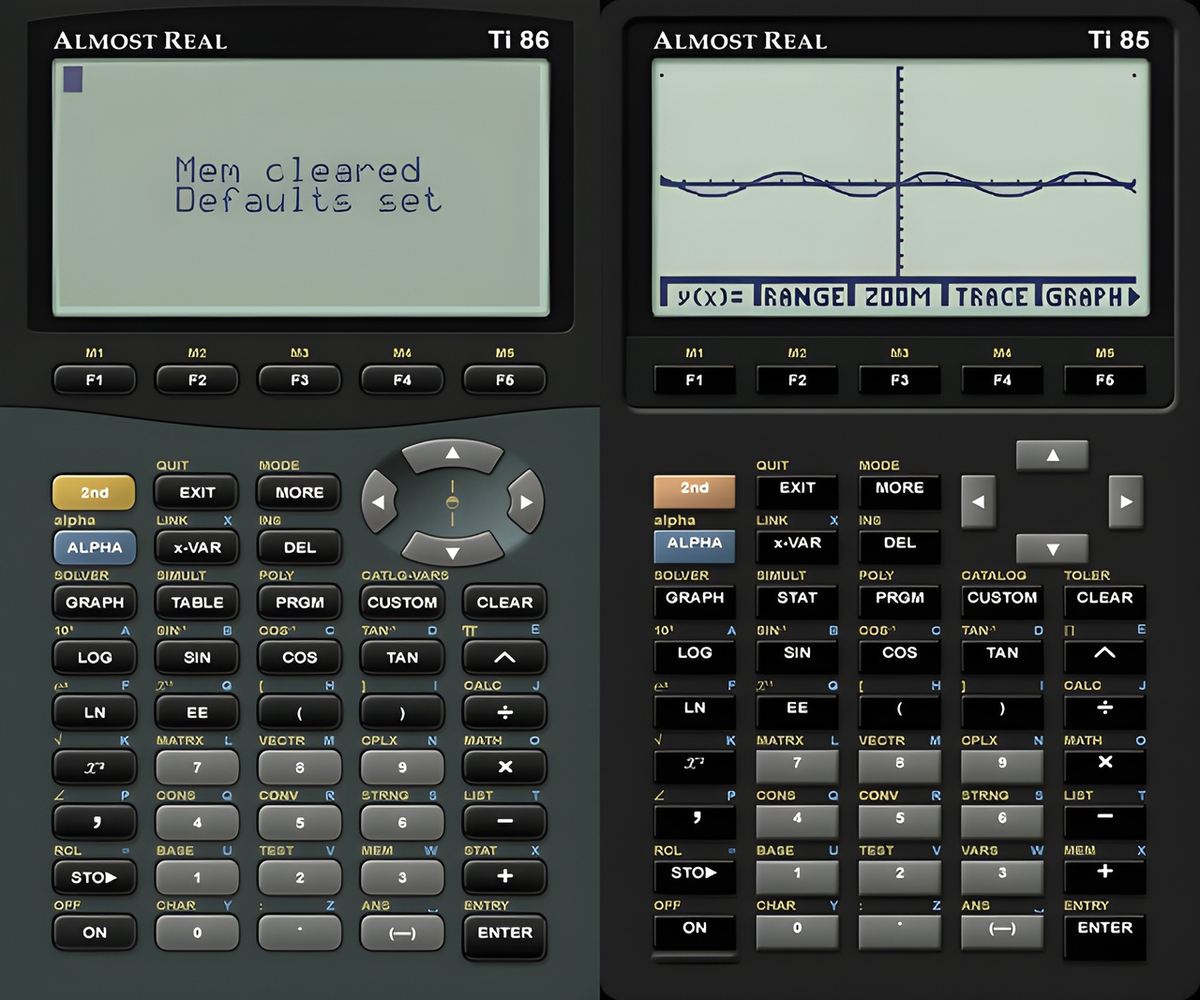
Missing your old Texas Instrument handheld? Spent entire nights learning every function while preparing for an exam and hoping that it would come to your rescue? AlmostTI has got your back. This Android app emulates a plethora of Texas Instruments calculators, including the TI-84+, TI-84+ Silver Edition, TI-83+, TI-83+ Silver Edition, TI-73, TI-83, TI-85, TI-86, TI-82, and TI-81.
In order to run, it requires the user to upload an original ROM (instructions available in the description of the Play Store). While it’s definitely not a high-definition solution, it cuts down learning times and provides a common interface for those who have learned to use it in the past.
- Graphic mode: 2D
- OS: Android
- Price: ⁓$5
- Ease of use: 3/5
Calcflow
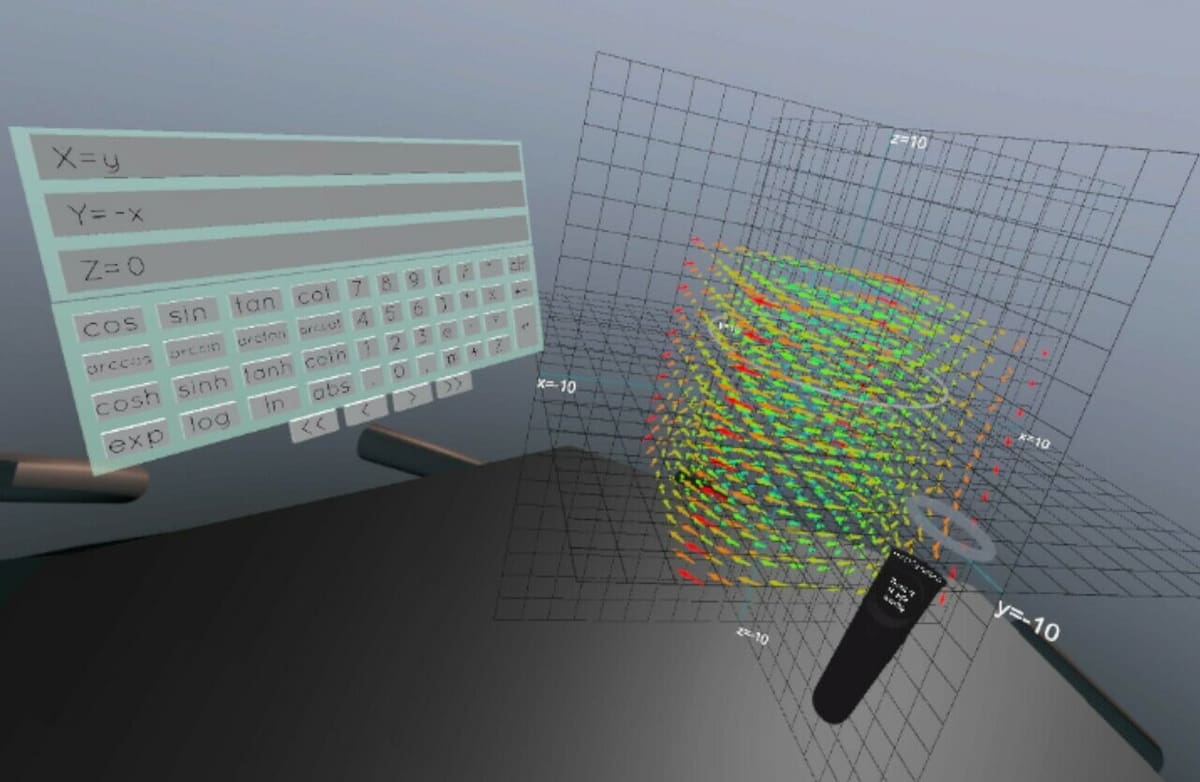
If you want to experience 3D graphs in three dimensions, take a look at Calcflow. It’s an open-source, virtual reality, 3D graphing calculator for Oculus and Vive that offers a completely new approach to plotting.
The advantage is that the human brain is capable of interpreting visual information quicker in an explorable 3D environment than it can with 2D projections. After experiencing functions in 3D, it becomes easier to understand even complex mathematical concepts.
By using the VR controls you are able to manipulate vectors with your hands. This transforms your headset into an ingenious didactic tool for exploring vector addition and cross products intuitively. If you don’t know expressions off the top of your head, you can load a series of presets into Calcflow and manipulate the variables to explore the manifold mysteries of math!
2D and 3D displays of a matrix with determinants, orthogonal projections, vector rotation, and an electron orbital visualizer are a few of the characteristics that Calcflow can offer.
- Graphic mode: 2D, 3D (VR scene)
- OS: HTC Vive, Oculus Rift, Valve Index
- Price: Free
- Ease of use: 3/5
CalcPlot3D
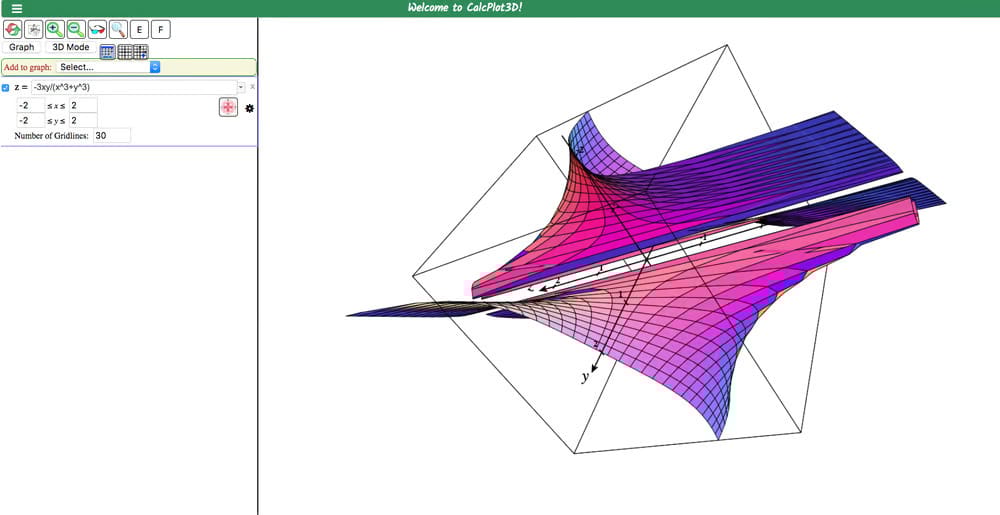
If you need a free and professional 3D graphing calculator that runs in the browser, CalcPlot3D is the only calculator you’ll ever need. The learning curve isn’t particularly steep, but the interface might feel unintuitive even after several hours of use.
The developers provide a long list of examples, but the “figuring it out” is left to the user. Thankfully, it’s not that hard. In terms of graphing capabilities, most 3D surfaces and other mathematical objects are supported.
The extensive viewport settings show that this tool was designed with professional users in mind. Graphs can be viewed as 2D projections, but you can also display them either as a true 3D plane (with more polygons) or as a wireframe. CalcPlot3D is the perfect 3D graphing calculator software tool for creating plots for publications since it features several styling options for creating contour plots of the graphs.
- Graphic mode: 2D, 3D
- OS: Browser
- Price: Free
- Ease of use: 3.5/5
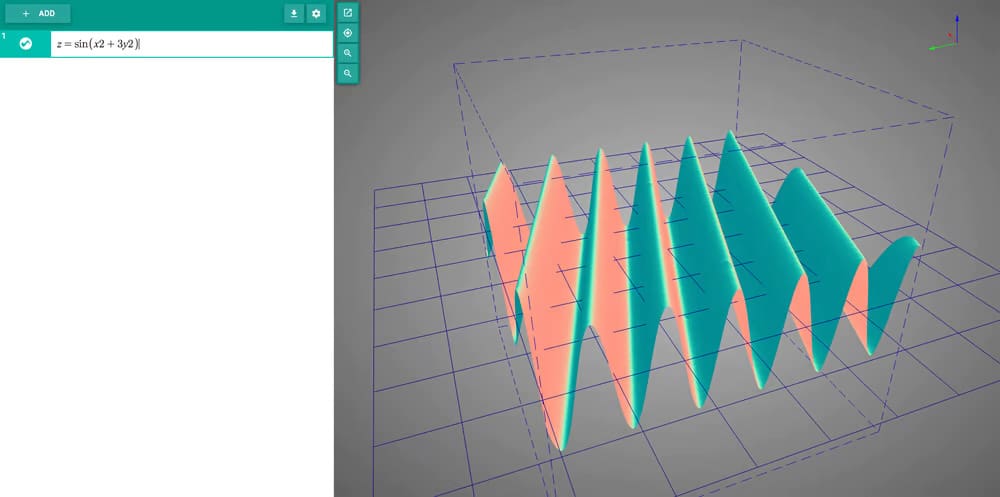
Functy
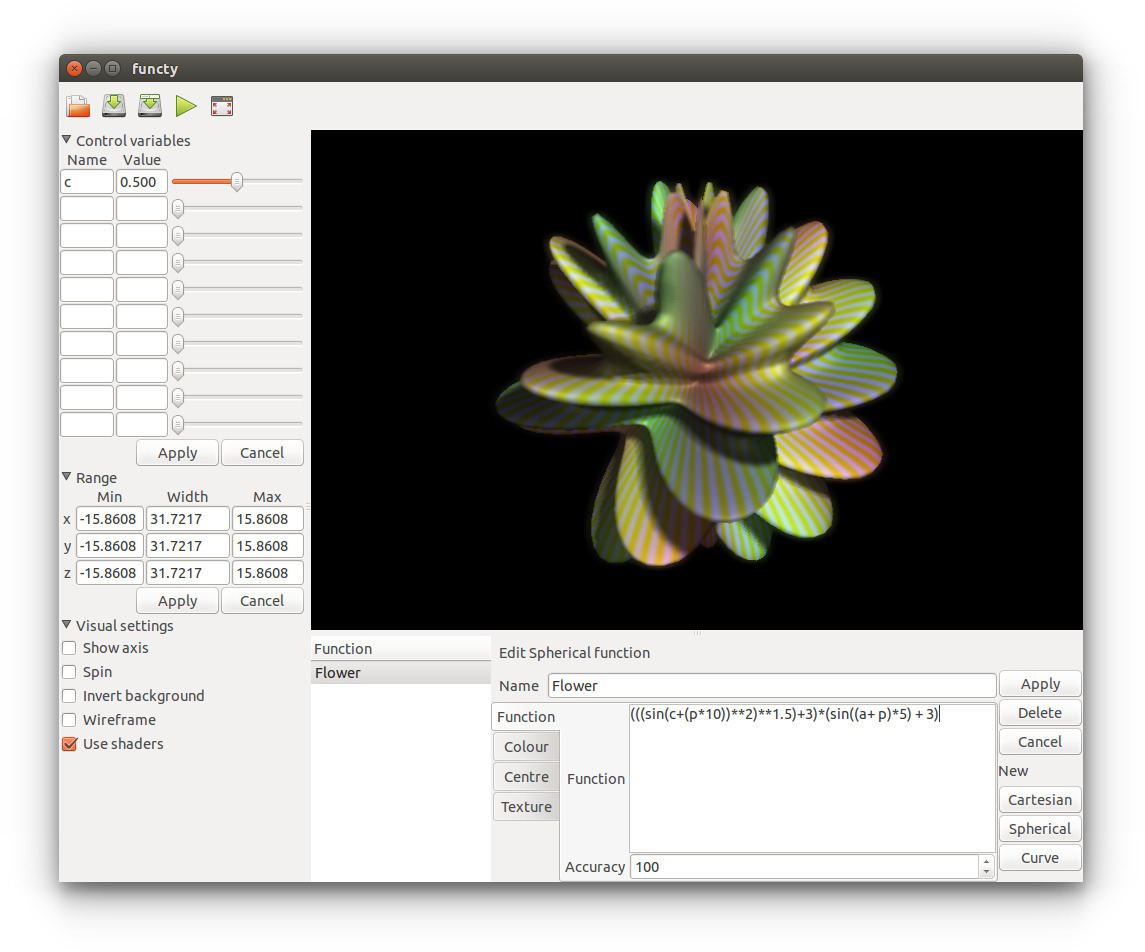
Functy is an open-source 3D-graph drawing package. The emphasis of the application is to allow Cartesian, spherical, and parametric curve functions to be plotted and altered quickly and easily. While the UI can appear a bit limited at first glance, it’s actually quite flexible.
The input equation automatically separates the variables. The sliders show the output graph in correlation to the variations in the input. The rendering engine is really barebone but supports shading and wireframing. Functy supports importing and exporting .svx voxel models.
A section dedicated to 3D printing and slicing is available on the Functy website. It covers a few topics, including the basics of voxelization of curves (the process of approximating a 3-dimensional surface to a defined set of cubes, much like a bitmap image is defined by a set of squared pixels). It’s fun reading for those who are interested in going a bit deeper into the rabbit hole of slicing software.
Overall, it’s only designed to do 3D graphing, and it lives up to expectations.
- Graphic mode: 3D
- OS: Windows, Linux
- Price: Free
- Ease of use: 4/5
Graphing Calculator 3D
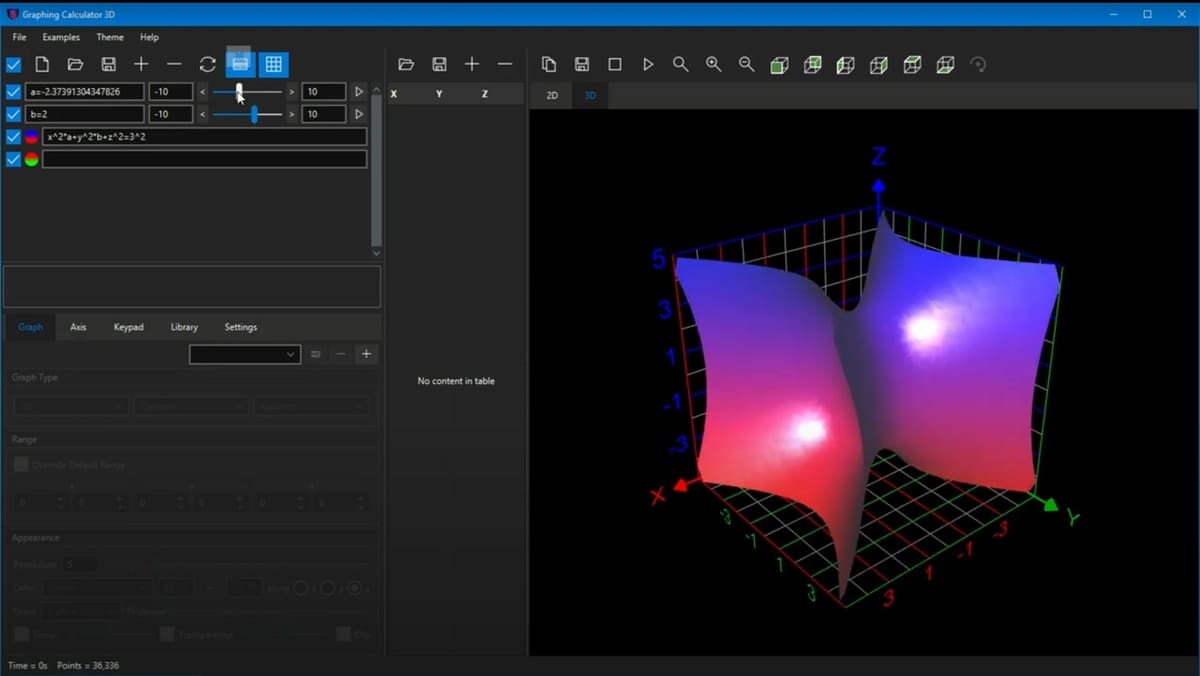
Unlike MacOS, Windows does not ship with its own 3D graphing calculator software tool. Luckily, there are some free solutions available, and one of them is Graphing Calculator 3D. This sophisticated program allows you to plot in 2D and 3D. It can also handle implicit and parametric equations.
Overall, the interface invites the user to explore and experiment with mathematical phenomena because, while you type the equation into the field to the left of the viewport, the graph is updated after each keystroke. Impressively, this 3D graphing calculator works with cartesian, polar, spherical, and cylindrical coordinate systems. What is more, you can import your own data as spreadsheets to plot it in Graphing Calculator 3D.
The appearance of plots can be manipulated down to the last details. For instance, there are comprehensive rendering options that you can use to style graphs according to your needs. Of course, it’s also possible to control the resolution of the graph by moving a slider.
In case you need the values of a range of points, it can output a table of values at the press of a button. This feature allows you to find solutions to complex problems easily, as well as have a more grounded point of view for statistical data. The spreadsheet can be imported into other programs (like Tableau) for more in-depth analysis.
The free version is limited to a 20 points/unit graph resolution and a 50-digit numerical precision. A premium version can be purchased for $199/year.
- Graphic mode: 2D, 3D
- OS: Windows, MacOS, Linux
- Price: Freemium, ⁓$200 annually for more features
- Ease of use: 4/5
MathGrapher
MathGrapher is a complete suite for 2D and 3D plotting, data structuring, matrix operation, and Lindenmayer systems. The interface, albeit old in the look, is functional and slim.
The 3D engine is designed to provide an extended range of tools for curve analysis, including surface isolation and curve slicing. The Lindenmayer systems used to generate fractal curves, growing patterns, and space optimization are truly beautiful to watch but represent an incredible tool too.
Aimed at engineers and scientists, it can also help with some high-school grade homework.
- Graphic mode: 2D, 3D
- OS: Windows
- Price: Free
- Ease of use: 4/5
Mathpix
Mathpix is a 3D graphing tool that runs in the browser, on PCs, and on mobile devices. It can solve equations, operate with vectors, and display point clouds and vector fields. Exports to 3D files are also supported.
The mobile apps are particularly convenient because they don’t require entering expressions manually. Instead, equations can be entered using image character recognition. Meaning students can take pictures to solve their math problems in case they are stuck.
Being a learning tool, Mathpix will not simply display the graph and the solution, but it will also guide the students step by step. This way they’ll be able to transfer what they’ve learned to the next problem. Conversely, teachers can speed up their grading of papers. Mathpix supports text conversion to LaTeX, MathML, TSV, MS Word, HTML, and Asciimath. It can also output a chemical formula in the ChemDraw or SMILES standard.
Mathpix offers a limited free version and a Pro subscription starting at $4.99 per month, up to $9.99 per month.
- Graphic mode: 2D, 3D
- OS: Windows, MacOS, Linux, Android, iOS, Browser
- Price: Freemium, $5-$10 monthly for more features
- Ease of use: 5/5
Quick Graph
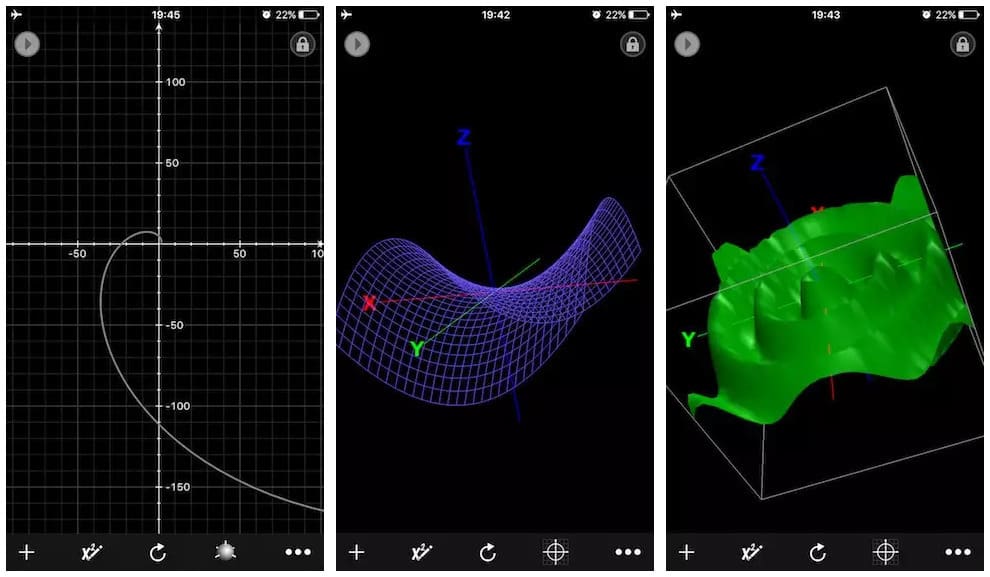
Quick Graph features an intuitive interface that makes entering equations really easy. You can input them in symbolic notation and visualize them as graphs, both in 2D and 3D. This app supports all the coordinate systems you could ask for: cartesian, polar, spherical, and cylindrical. In 3D mode, graphs can be shaded and lit to bring out the depth of the surface you’re studying.
To make plotting even easier, Quick Graph comes with a library of commonly used equations. Most of the feature set is free. The viewport can display up to six graphs at a time – in case that does not cover your needs, you can upgrade. The paid version also includes implicit graphs, inequalities, and other advanced features for $4.99.
- Graphic mode: 2D, 3D
- OS: iOS
- Price: Freemium, ⁓$5 for more features
- Ease of use: 5/5
Wolfram Alpha
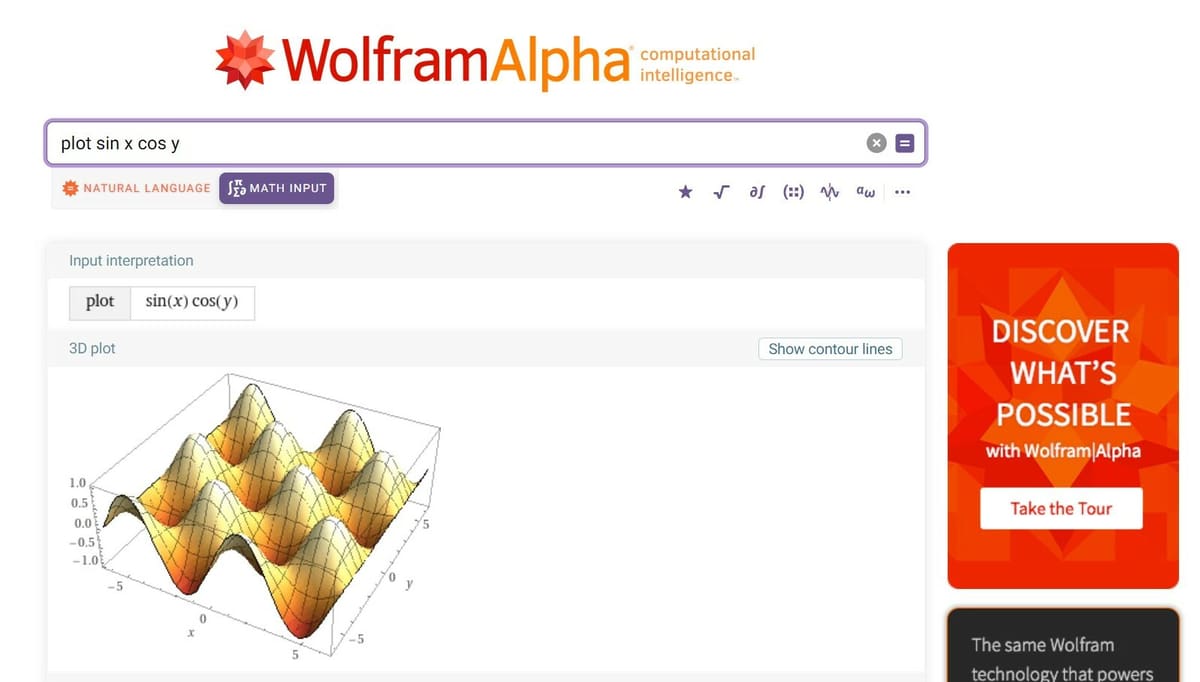
Based on the Wolfram Language, Wolfram Alpha is a multipurpose computational platform. In other words, it can do everything: from solving equations to showing demographics and social statistics data, from chemistry formulas to image processing, and much, much more. If it’s researchable, Wolfram has it.
In terms of calculation capabilities, it covers every inch of the Calculus, Algebra, and Physics curricula. It can plot 2D and 3D graphs, with various coloring options available. Unfortunately, the viewport is static and not interactive. The Pro version supports step-by-step solutions and tips for improving your problem-solving skills, starting at $4.75 monthly for students.
The interface is a mix of very easy and quite elaborate functionalities. For instance, the user can input equations in a symbolic or text form, but to get certain results text commands are required. For example, entering “x^2 y^3” will output the solution as well as the plot, range, roots, domain, and much more.
You can ask it to only plot something by using “plot x^2 y^3, x=-1.1, y=0.3” (x and y values added as an example). You can also ask for a “3d parametric plot (cos u, sin u + cos v, sin v), u=0 to 2pi, v=0 to 2pi“, and specify the desired range of evaluation. We definitely suggest taking a look at the immense example list.
Wolfram also offers the more advanced Wolfram Mathematica, which is similar to MatLab for certain aspects. All Wolfram apps can be accessed via the cloud for free (albeit being a bit limited).
- Graphic mode: 2D, 3D
- OS: Browser, Windows, MacOS, iOS, Android
- Price: Freemium, $5-$8.5 monthly for more features
- Ease of use: 3.5/5
Advanced/Professional
It’s when you can’t find a single Latin letter in your equation that you know you’ve ascended to the Olympus of Math. These programs will help you keep your sanity.
Giac/Xcas
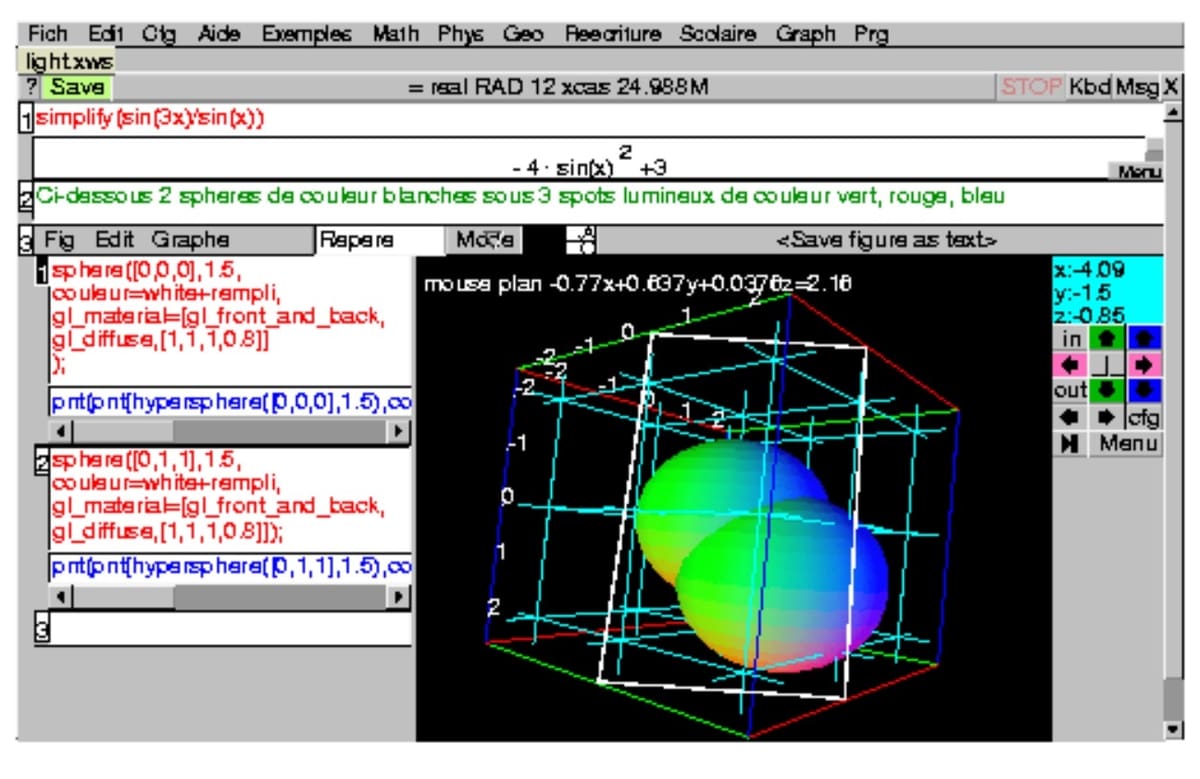
The Giac/Xcas duo is oftentimes referred to as the swiss army knife of mathematics. In particular, Gias is a C++ library (GeoGebra and HP Prime Calculator are partially based on it), while Xcas is the user interface that allows us to communicate more easily with the CAS kernel (Gias).
The interface itself is not extremely hard to learn. Inputs must be provided to the program in a string form. For example, “plot(3 * x^2 – 5)” will draw the graph of that equation. Both 2D and 3D plots are supported. Xcas also supports operations on spreadsheets as well as python, java, and JavaScript inputs.
While it might not be the most straightforward option, its potential is immeasurable.
- Graphic mode: 2D, 3D
- OS: Windows, MacOS X, Linux
- Price: Free
- Ease of use: 2.5/5
MatLab
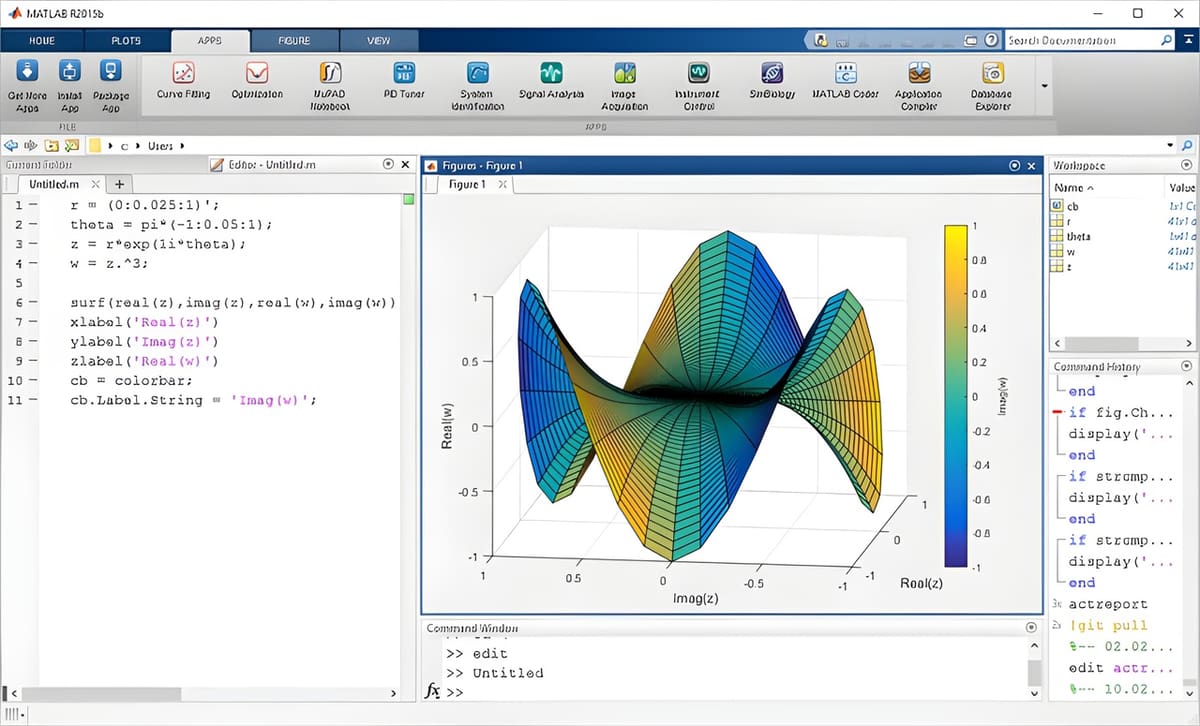
MatLab is used by millions of engineers and scientists worldwide to process data and work with matrix and array mathematics.
The software’s most powerful feature is numerical analysis and computing large amounts of data. It’s based on a programming language (MatLab) that is used to quickly create scripts to document and evaluate data. You can learn this with one of the many free courses provided by MathWorks or the included tutorials. After that, you can simply input the equation you want to have solved and plotted.
Other than its own programming language, MatLab offers a toolbox to quickly calculate and depict functions. These can be graphically displayed in many customizable 2D, 3D, and even 4D (time is a dimension, after all) graphs varying in color. It also offers plug-ins for image data processing, controlling for dynamic and embedded systems or signal processing. MatLab is available for all platforms. It even offers a mobile app to solve a few problems as well as access and edit your files on the go.
This powerful software, however, comes with a hefty price tag. Single consumer licenses range from $800 to $2,000. You can also try MatLab for 30 days, and many technical or economical universities offer a student license.
- Graphic mode: 2D, 3D, 4D
- OS: Windows, MacOS, Linux
- Price: $800-$2,000
- Ease of use: 2/5
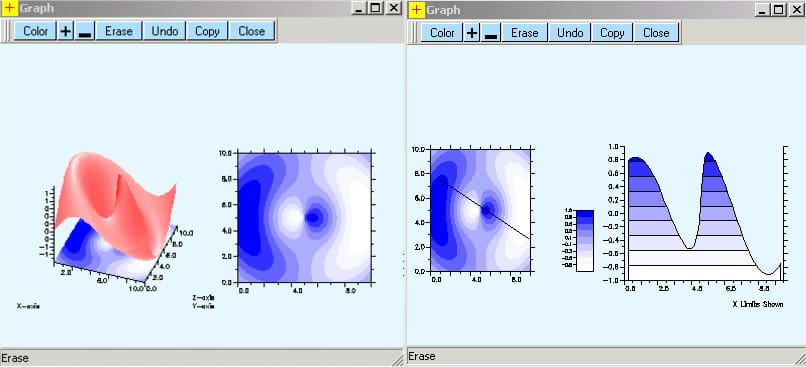
Veusz
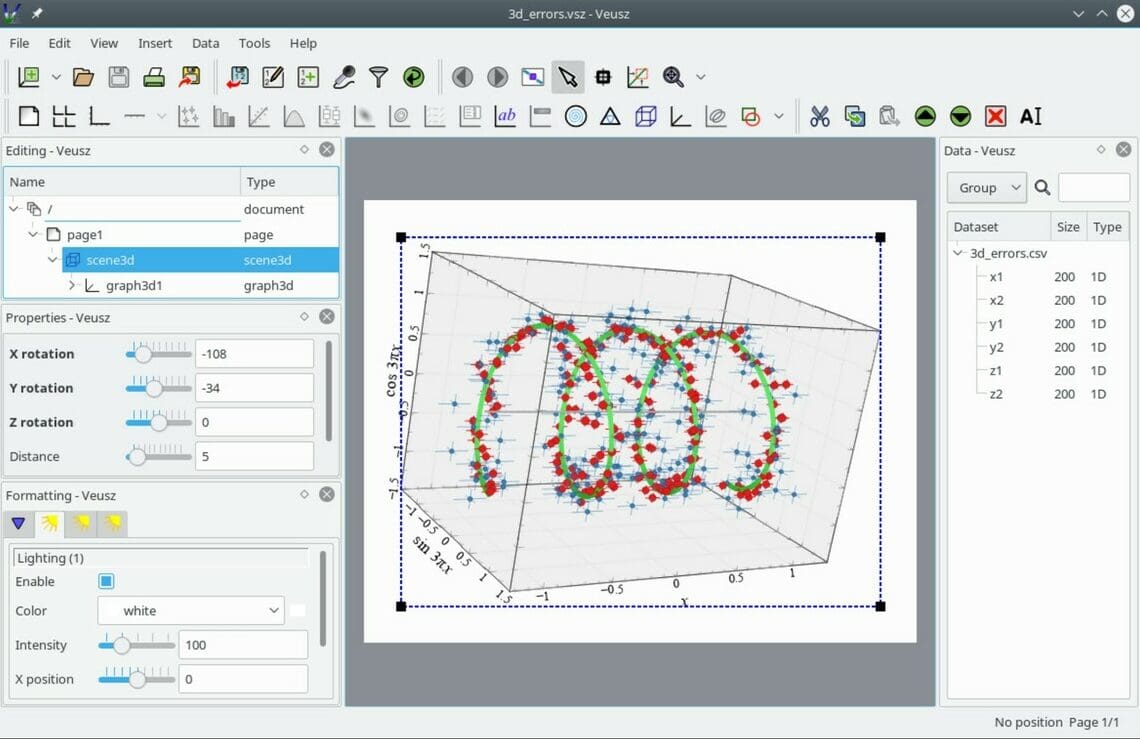
Veusz is a versatile plotting package that supports practically every type of 2D and 3D graph known to mankind. From spectrum to multiple axes to ternary plots and many, many more. While it’s designed to output a publication-ready graph, it can also be used to accurately display other everyday equations.
The UI is elastic but tough to get used to, with functionalities split between windows and plug-ins. Inserting a function requires manually defining the axis orientation and number first, then choosing the preferred visualization method. We don’t recommend it for occasional users because of this.
- Graphic mode: 2D, 3D
- OS: Windows, MacOS, Linux
- Price: Free
- Ease of use: 2.5/5
Bonus
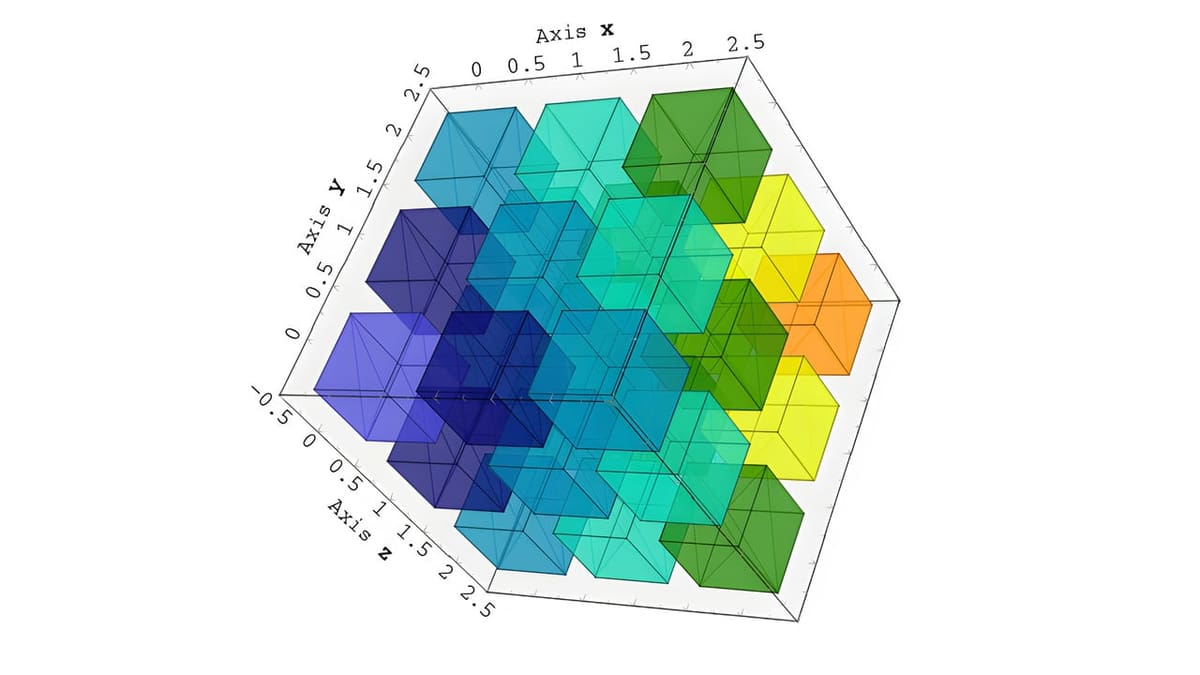
Minecraft Graphing Calculator
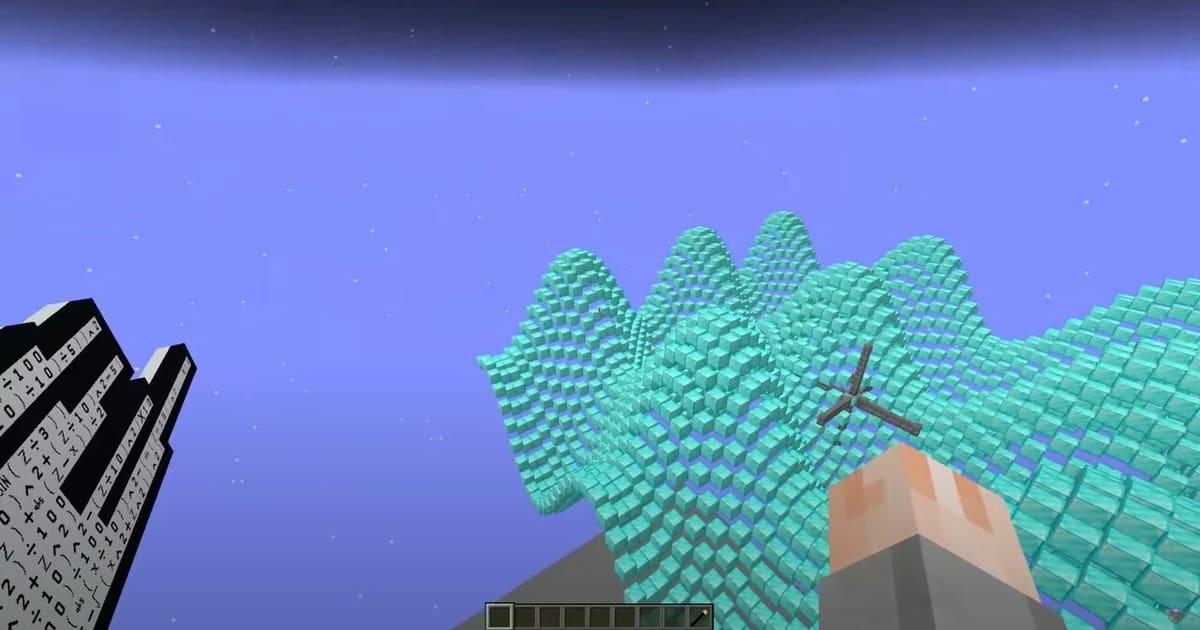
If you don’t mind building your equation with blocks, this Minecraft map might be fun. Depending on the complexity of the input, drawing might take a while, but the mesmerizing result is definitely worth it. It’s not equally great if you were trying to avoid math by taking cover in a Minecraft world.
The map is available for free as a standalone download or as a Minecraft Realm. No mods are required, just a resource pack (already included in the map).
- Graphic mode: 2D, 3D
- OS: Minecraft
- Price: Free
- Ease of use: 4/5
License: The text of "The Best 3D Graphing Calculators (Online & Offline)" by All3DP is licensed under a Creative Commons Attribution 4.0 International License.