3D Printed Infographics: Statistics Never Looked So Good

Relaying statistical data doesn’t necessarily have to be dull. Especially not when you have 3D printed infographics which feature playful plastic pieces.
Coming Soon are a Belgian creative studio who used 3D printing to jazz up the annual report for biopharmaceutical company Ablynx. The information graphics feature a series of eight illustrations which bring both physical components with digital graphics and typography.
To do this, they use quirky ways to represent the information, meaning a chart about cash and expenses becomes colorful and intriguing by using small figures and 3D printed parts.
Other ideas include; tiny figures walking through a sequence of blue lines which show data about the number of products in the clinic according to year.
How do the 3D Printed Infographics Work?
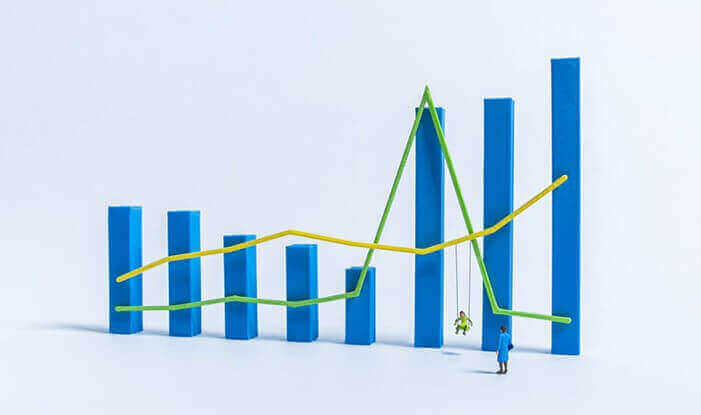
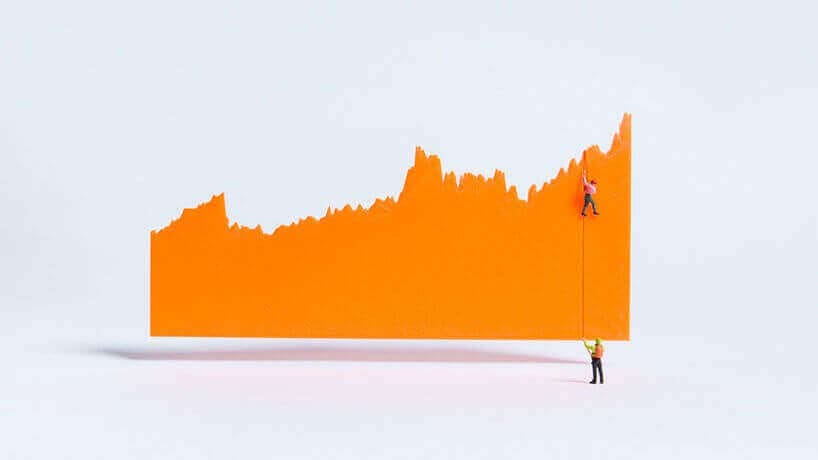
The compositions are being used to show either performance, operating or income statistics in a sequence but to make this work, 3D printed forms and color were used.
The text which accompanies these charts explains the collected data and figures, but 3D printed parts have been made in the shape of line and bar graphs, as well as some very cute pie charts.
The clever part is the fact that each of the plastic parts were constructed and configured very carefully to correlate to all of the statistical information given, meaning they’re adorable and accurate.

The very final and super quirky stage of the compositions is, of course, the addition of miniature figures.
These tiny figures have been made to interact and play with the diagrams, whether it’s; climbing on them, swinging from graphs or simply walking through the plastic pieces.
This seems like a great way to keep your employees interested in company facts and figures. What do you think about these 3D printed infographics? Let us know in the comments.

License: The text of "3D Printed Infographics: Statistics Never Looked So Good" by All3DP is licensed under a Creative Commons Attribution 4.0 International License.