![Featured image of [Project] 3D Print An Actual Earthquake Map](https://i.stageall3dp.com/workers/images/fit=scale-down,w=1200,h=675,quality=79,gravity=0.5x0.5,format=auto/wp-content/uploads/2018/01/26170309/earth-e1516978414756.jpg)
[Project] 3D Print An Actual Earthquake Map

Oakland artist and Instructables user Doug McCune shares a project that shows how you can turn data generated from an earthquake into a 3D printed topographical map. Shake up your weekend with this great DIY project!
One field that 3D printing has recently emerged as a vital tool for is disaster relief, particularly in remote areas and impoverished communities.
For instance, in April 2016, Oxfam and Field Ready joined together to use 3D printing for humanitarian aid in Nepal. The country had just been devastated by a 7.8 magnitude earthquake, leaving their water system at risk of contamination. The collaborative organizations used 3D printing to create parts like water pipe fittings, proving the immense value of this technology in the face of nature’s wrath.
Thanks to Oakland data artist Doug McCune, you can actually take the data from any earthquake and 3D print a topographical map. Back in 2016, McCune shared his groundbreaking (pun intended) project on the DIY website Instructables, going into detail on how to take a “shakemap” and turn it into a STL file.
And hey, what better way to shake up your weekend than by undertaking a fun and educational 3D printing project. We’ll explain what you need to 3D print an earthquake map. However, once you’re finished with our brief introduction, be sure to check out the comprehensive step-by-step guide on Instructables.
In the past, we’ve covered McCune’s use of data and 3D printing to create a sculpture of San Francisco’s housing crisis. The artist has also used similar methods to 3D print hurricanes and tornados.
3D Printing an Earthquake: What You Need & How to Proceed
3D Print an Earthquake: What do I need?
- ShakeMap
- QGIS
- NodeJS
- STL File Viewer
- 3D Printer
To start things off, you’re going to need to find the earthquake you’d like to print. Whether you want to replicate a tremor you personally experienced, one that was historically disastrous, or even create your own scenario, you can find all this and more on ShakeMap.
After you locate the earthquake you wish to print, select it and go to the Downloads section. From here, you’ll continue into GIS File > Shape Files, which is the data you need.
McCune explains the different shapefiles that you’ll find here: “The shapefile download of an earthquake contains multiple shapefiles that represent different measurements of shaking. PGA is peak ground acceleration, PGV is peak ground velocity, and MMI is Modified Mercalli Index.” For his example, he converts the PGV map into a 3D printable model.
To view the contents of the map, the data artist recommends QGIS, a free and open source geographic information system. This program will present you with a contour map, which is essentially a topography map displaying intensity of the quake instead of elevation.
From here, you’ll need to download (or open) NodeJS, where you will use McCune’s “shp2stl” utility tool from GitHub. After that, create a new file called quake.js, which will contain the JavaScript code you’ll execute to convert the shapefile into a 3D model. There are a few more steps that involve some simple coding and script running, all of which you can find in detail on the Instructables page.
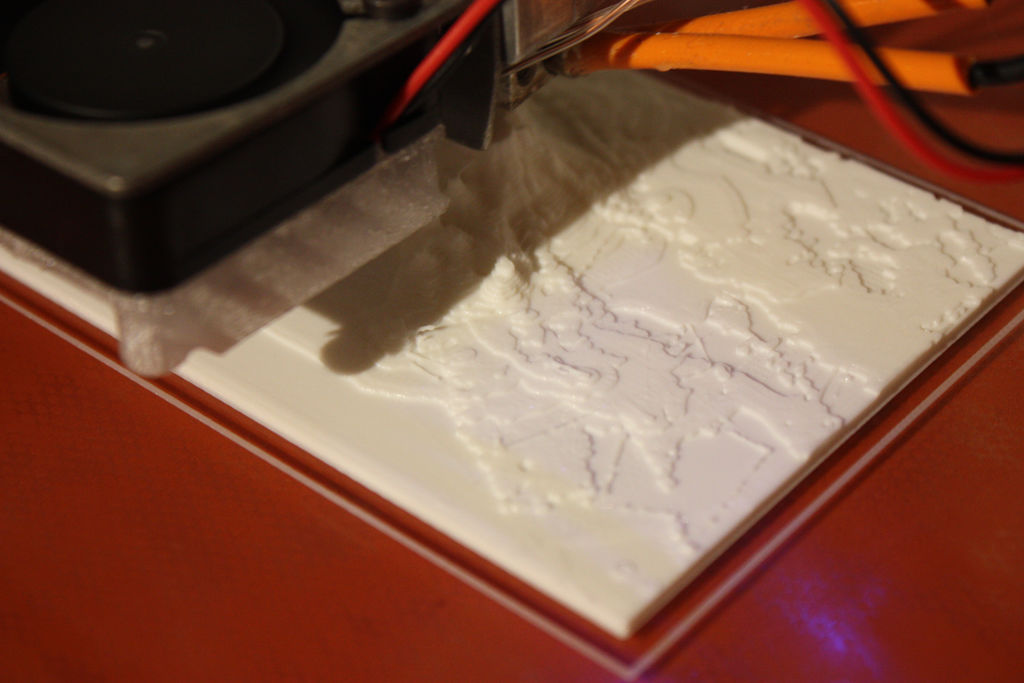
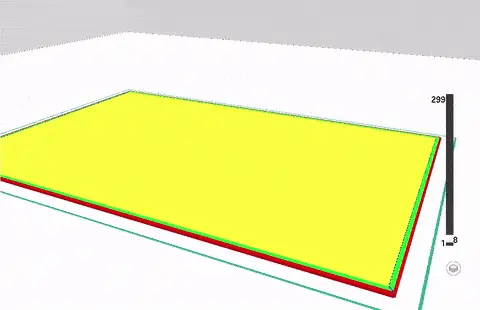
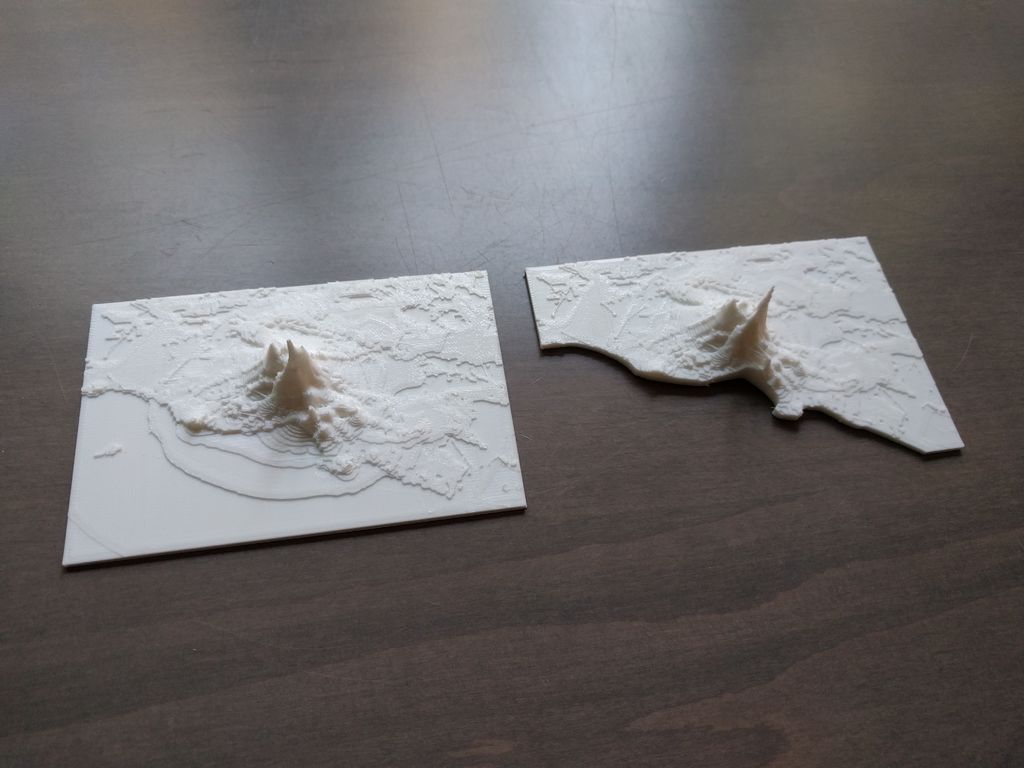
After a few more steps, quake_model.stl will be generated in your project directory. You can view the STL file in a number of different softwares, including Blender or MeshMixer. Finally, you’ll have an earthquake map ready to slice and print. If you want to take things one step further, you can use QGIS to distinguish between land and ocean, presenting you with a more accurate and uniquely shaped map. McCune also goes into how to do this on the project page.
To get started on this fun weekend project, head over to Instructables to get the full scoop. We hope our introduction to the “3D Print an Earthquake” project has inspired your maker spirit. If so, have a good time and print responsibility!
Did you put on your hardhat and take on this weekend project? Let us know how it went in the comments!
License: The text of "[Project] 3D Print An Actual Earthquake Map" by All3DP is licensed under a Creative Commons Attribution 4.0 International License.